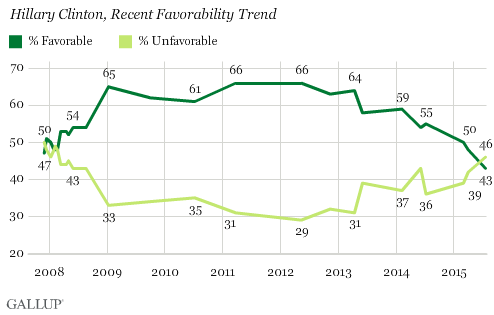
 PRINCETON, N.J. — Vermont Sen. and Democratic presidential candidate Bernie Sanders’ favorable rating among Americans has doubled since Gallup’s initial reading in March, rising to 24% from 12% as he has become better known. Hillary Clinton’s rating has slipped to 43% from 48% in April. At the same time, Clinton’s unfavorable rating increased to 46%, tilting her image negative and producing her worst net favorable score since December 2007.
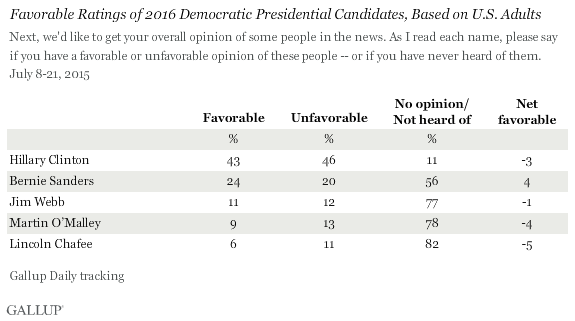
Sanders’ increased favorability reflects the broader increase in the public’s familiarity with him since March. Overall, 44% of Americans are able to rate him today, up from 24% in March. Not only has the percentage viewing him favorably increased, but also the percentage viewing him unfavorably has risen, up eight percentage points to 20%.
Clinton’s Inauspicious Rivals
Clinton maintains a higher absolute favorable rating from Americans than any of her official rivals for the 2016 Democratic nomination. In contrast to the relative prominence of numerous candidates on the Republican side, she remains the only Democratic candidate known well enough by a majority of Americans for them to rate her, which helps Clinton maintain a higher overall favorable score.
Sanders is still an unknown to a majority of Americans, with just 44% able to rate him compared with Clinton’s 89%. Total familiarity drops still further among the other three announced Democratic candidates: to 23% for former Virginia Sen. Jim Webb at 23%, former Maryland Gov. Martin O’Malley at 22% and former Rhode Island Gov. Lincoln Chafee at 17%. With slightly more Americans viewing each of these candidates unfavorably than favorably, their favorable scores reach no more than 11%.
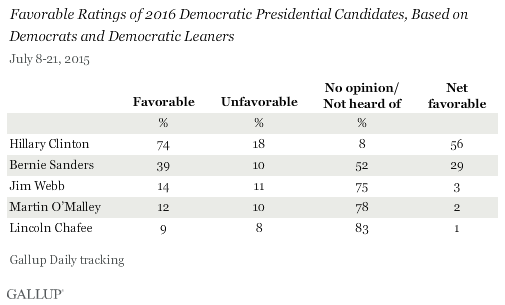
The favorable scores of Sanders, Webb, O’Malley and Chafee are not much more encouraging for any of them among their key target audience — Democrats and Democratic-leaning independents. While Sanders’ +29 net favorable rating among Democrats is considerably more positive than it is among the general population, still barely half of all Democrats know of him. And the picture is considerably bleaker for the other candidates, none of whom stirs much positive excitement among his or her base or cracks 30% familiarity.
Clinton Enjoys Broad Democratic Appeal
Clinton’s favorable rating has slipped slightly among Democrats and Democratic-leaning independents since April, falling to 74% from 79%. This partly accounts for her overall decline in favorability among the public. The other factor is a drop among non-leaning independents, from 44% to 36%, while her image among Republicans and Republican leaners is essentially unchanged at 14%.
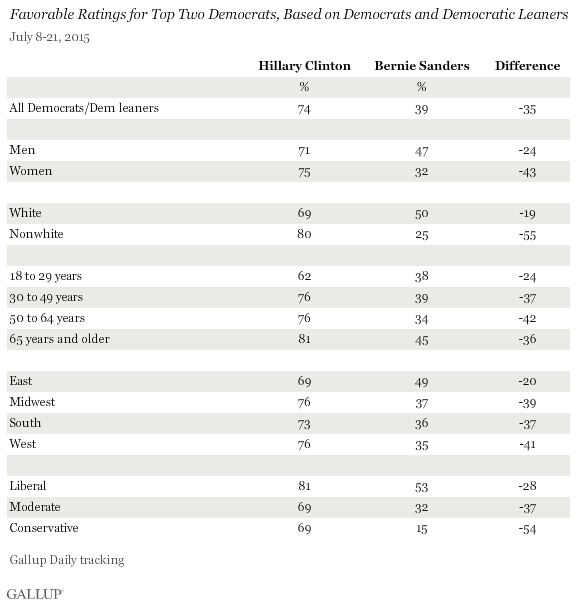
Among Democrats and Democratic leaners, Clinton is currently viewed more favorably by older than younger adults, by nonwhites than whites and by liberals than moderates or conservatives. However, she retains solid majority favorable scores from all of these groups. And she enjoys equally high ratings from men and women as well as in each of the four major regions of the country.
Sanders’ Democratic favorable scores significantly trail Clinton’s in all subgroup categories, but he comes the closest to her among whites, men, young adults and liberals. The gap between the two candidates is also closer in the East, where Sanders lives, than in the rest of the country. But he does especially poorly among nonwhites and conservative Democrats, trailing Clinton by more than 50 points in each group.
Bottom Line
Clinton’s national image has taken a slight turn for the worse, which is also evident in her image among Democrats. But she remains the only Democratic candidate for president with a national name, and Clinton continues to stand head and shoulders above her next closest competitor — Sanders — in popularity for the presidential nomination.
Survey Methods
Results for this Gallup poll are based on telephone interviews conducted July 8-21, 2015, on the Gallup U.S. Daily survey, with a random sample of 2,374 adults, aged 18 and older, living in all 50 U.S. states and the District of Columbia. For results based on the total sample of national adults, the margin of sampling error is ±2 percentage points at the 95% confidence level.
For results based on the total sample of 966 U.S. adults who identify as or lean Democratic, the margin of sampling error is ±4 percentage points at the 95% confidence level. All reported margins of sampling error include computed design effects for weighting.
Each sample of national adults includes a minimum quota of 50% cellphone respondents and 50% landline respondents, with additional minimum quotas by time zone within region. Landline and cellular telephone numbers are selected using random-digit-dial methods.
Learn more about how the Gallup U.S. Daily works.

Leave a Reply
You must be logged in to post a comment.